-
Monitor activities on your home network

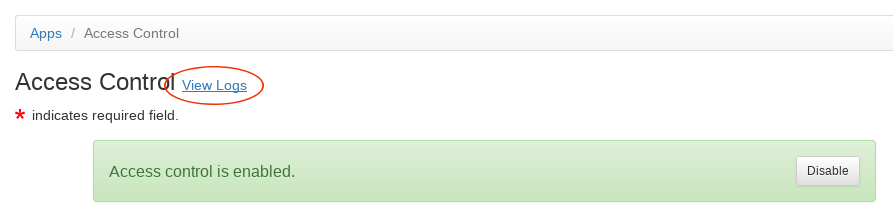
The pcWRT router provides two ways to monitor your network activities. You can view every site visited (or blocked) by each device (or user) by clicking the “View Logs” link on the Access Control page. And you can view the bandwidth consumption of each device on the Bandwidth Monitor page.Access Logs
Click the View Logs link on the Access Control page to enter the Internet Logs page.
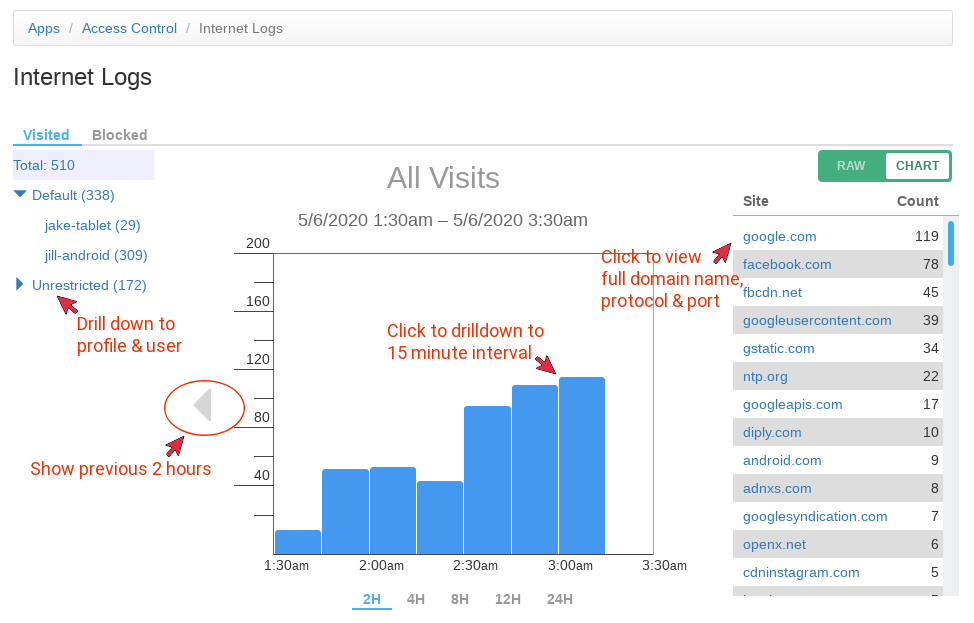
The Internet Logs page displays a bar chart showing all web sites visited during the past two hours, where you can:
- Drill down to the profile and user by clicking links on the left
- Drill down to 15 minute intervals by clicking on the bars displayed
- Come out of drilldowns by clicking on the Total link or a blank area on the bar chart.
- Click on a site link to see the full domain name, protocol and port.
- Click on the left and right navigation icons to navigate to the previous 2 hour bracket or the next 2 hour bracket.
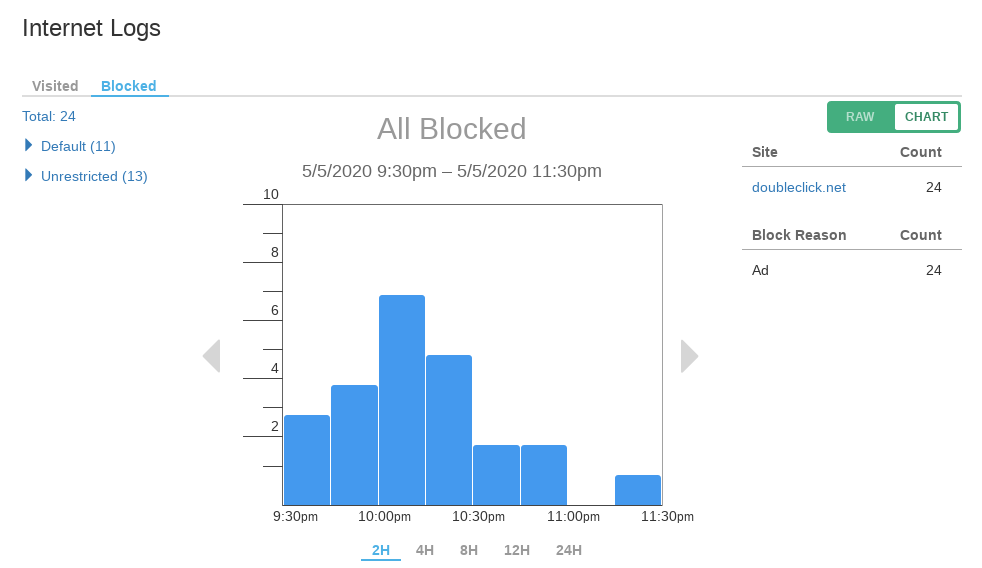
To see what sites are blocked, click the Blocked tab. The “blocked” view basically shows the same information. But it also displays a table showing the block counts by blocked reason.
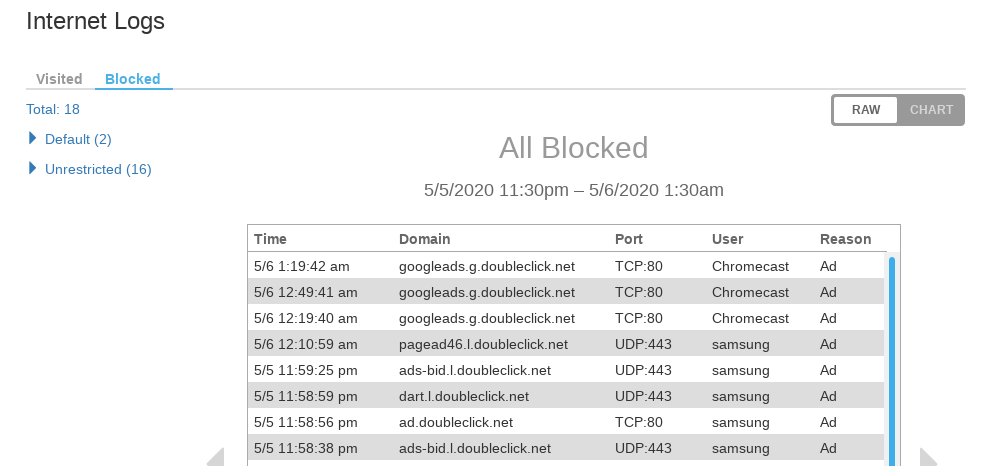
Access Logs Raw Mode
You can switch to the raw mode by clicking on the Raw/Chart switch.

The navigation and drill down controls are the same as that in chart mode. But the raw mode gives a lot more details about each request. This is especially useful when something was falsely blocked, or an app or web site was not working as expected.
For visited web sites, the row mode also records the first 15 bytes of a new connection. So that you can get a glimpse of what’s being sent out.
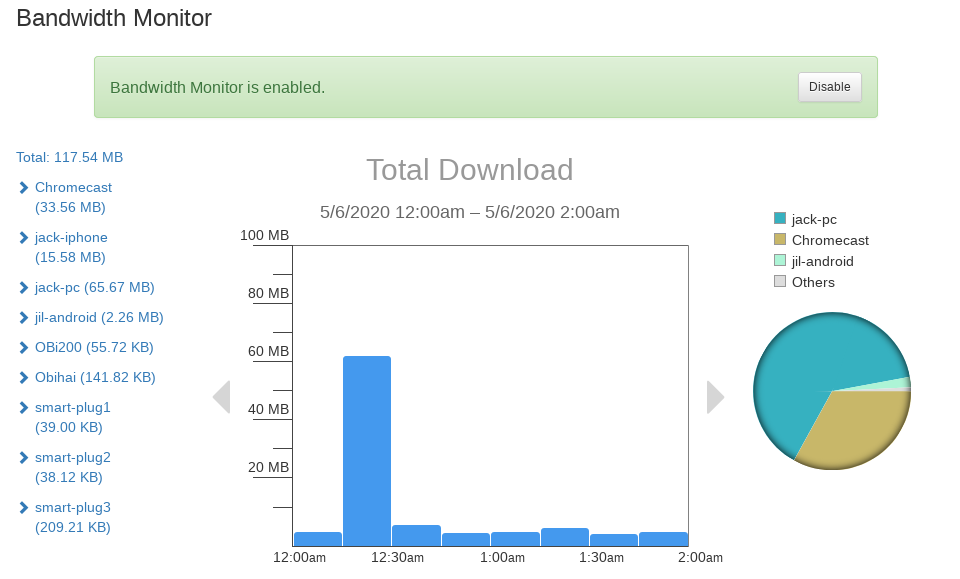
Bandwidth Monitor
The Bandwidth Monitor page displays the bandwidth consumption for each device. It also displays a pie chart so that you can easily see which devices are using the most bandwidth.
And, if Access Control is enabled for a device, you can find out which web sites consumed the most bandwidth (from that device) by clicking on the device name.


Recent Posts
- Observing Android VPN Leaks with the pcWRT Router
- How to set up a second pcWRT router as an Access Point with VLAN support
- Is the MELLO charger a scam (Kickstarter)?
- How to reset the pcWRT router
- How to create your SSH key and use it on the router
Recent Comments
- on How to reset router password by email
- on How to reset router password by email
- on Does your parental control pass the DOH test?
- on How to create your SSH key and use it on the router
- on How to create your SSH key and use it on the router
Archives
- January 2025
- December 2024
- June 2024
- April 2024
- March 2024
- August 2023
- May 2023
- February 2023
- June 2022
- December 2021
- November 2021
- August 2021
- January 2021
- December 2020
- October 2020
- August 2020
- July 2020
- June 2020
- May 2020
- April 2020
- February 2020
- January 2020
- December 2019
- October 2019
- December 2018
- August 2018
- July 2018
- June 2018
- January 2018
- November 2017
- October 2017
- September 2017
- August 2017
- July 2017
- June 2017
- January 2017
- August 2016
- May 2016
- December 2015
- August 2015
- July 2015
- May 2015
- April 2015
- March 2015
Categories


How can I use the 15 bytes? Through them what can I find out?
Please, can you show us how to use these 15 bytes?
Thanks.
The first 15 bytes gives you an idea what protocol is used for communication. Most importantly, is the communication encrypted?